Glossary 📕 
Dataframes keywords 
MA 
Description : MA (Moving Average) represents the average value on a given length (20-30 elements for GreedyBoy).
It means that if we’re checking prices every 15min, we’ll need 20*15min of price values to determine the first moving average.
Moving average formula : \(MA = \frac{Sum\ of\ elements}{Number\ of\ elements}\)
Type
:
float
Std 
Description : Std (Standard Deviation) represents the standard deviation on a given length (20-30 elements for GreedyBoy).
It means that if we’re checking prices every 15min, we’ll need 20*15min of price values to determine the first standard deviation.
Standard Deviation formula : \(Std = \sqrt{\frac{Sum\ of\ squared\ deviation\ from\ MA\ of\ every\ elements}{Number\ of\ elements}}\)
Type
:
float
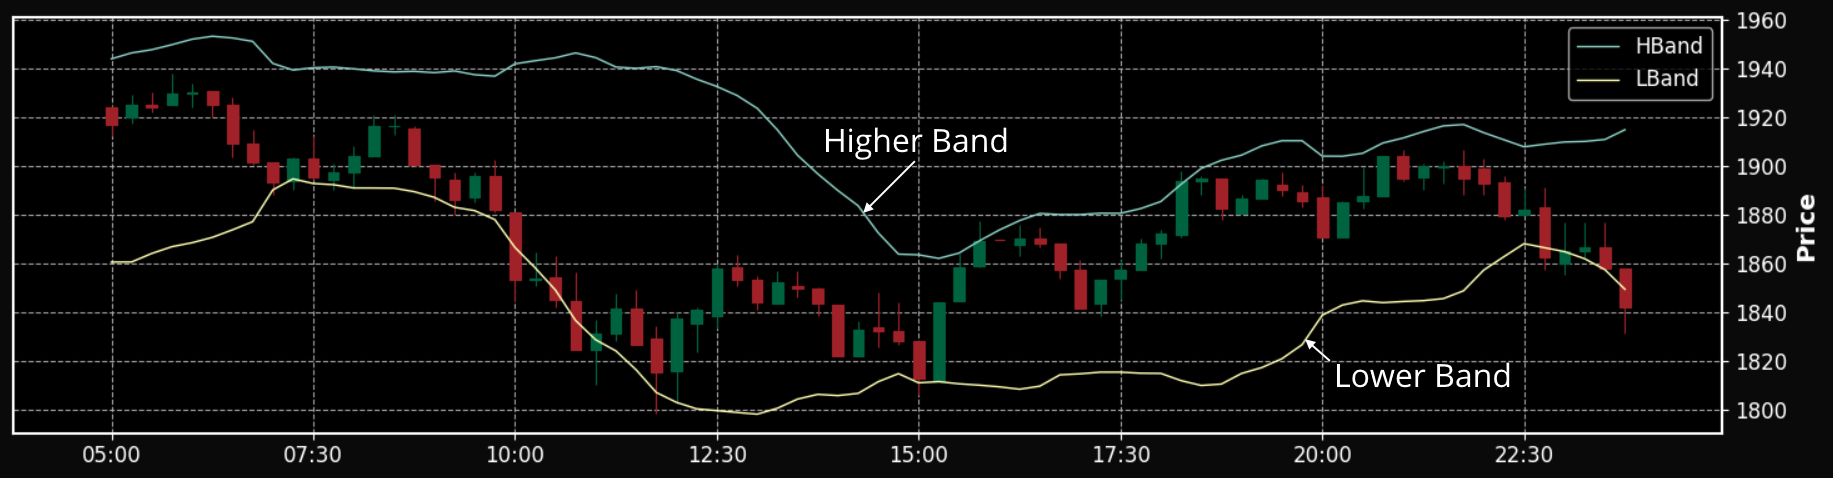
HBand 
Description : HBand (Higher Band) represents the higher bollinger band.
It means that if the Close price is going over this band, then the price is rising at an abnormal rate.
Higher Band formula : \(HBand = MA + Std * 2\)
Type
:
float
LBand 
Description : LBand (Lower Band) represents the lower bollinger band.
It means that if the Close price is going under this band, then the price is dipping at an abnormal rate.
Lower Band formula : \(LBand = MA - Std * 2\)
Type
:
float
Technical notions 
Bollinger Bands 
Description : A Bollinger Band is a technical analysis tool based on pretty simple maths.
Basically, you take the moving average and the standard deviation of at least 20 Close prices and then you subtract and add 2x the standard deviation to the moving average to form a Bollinger Band .
Day Trading 
Description : To put it simple, Day Trading is a form of speculation in which the trader makes orders (buy/sell) in the same day.
GreedyBoy is meant to make profit of this practice, mainly because… it is a bot. One of the worst issues about Day Trading is emotions like greed, fear or panic.
GreedyBoy and every trading bots do not perform based on emotions so they get better results.
Backtesting 
Description : Backtesting basically means testing a predictive model on historical data.
With GreedyBoy, the Backtesting is done through data we retrieve from Kraken and store into .csv files.
We use a pretty compact format of historical data that we were forced to retrieve ourselves.
In average, the time gap between each price is of 5 seconds. In order to ensure the security of the results of GreedyBoy on day trading operations.