GraphViewer 
Description 
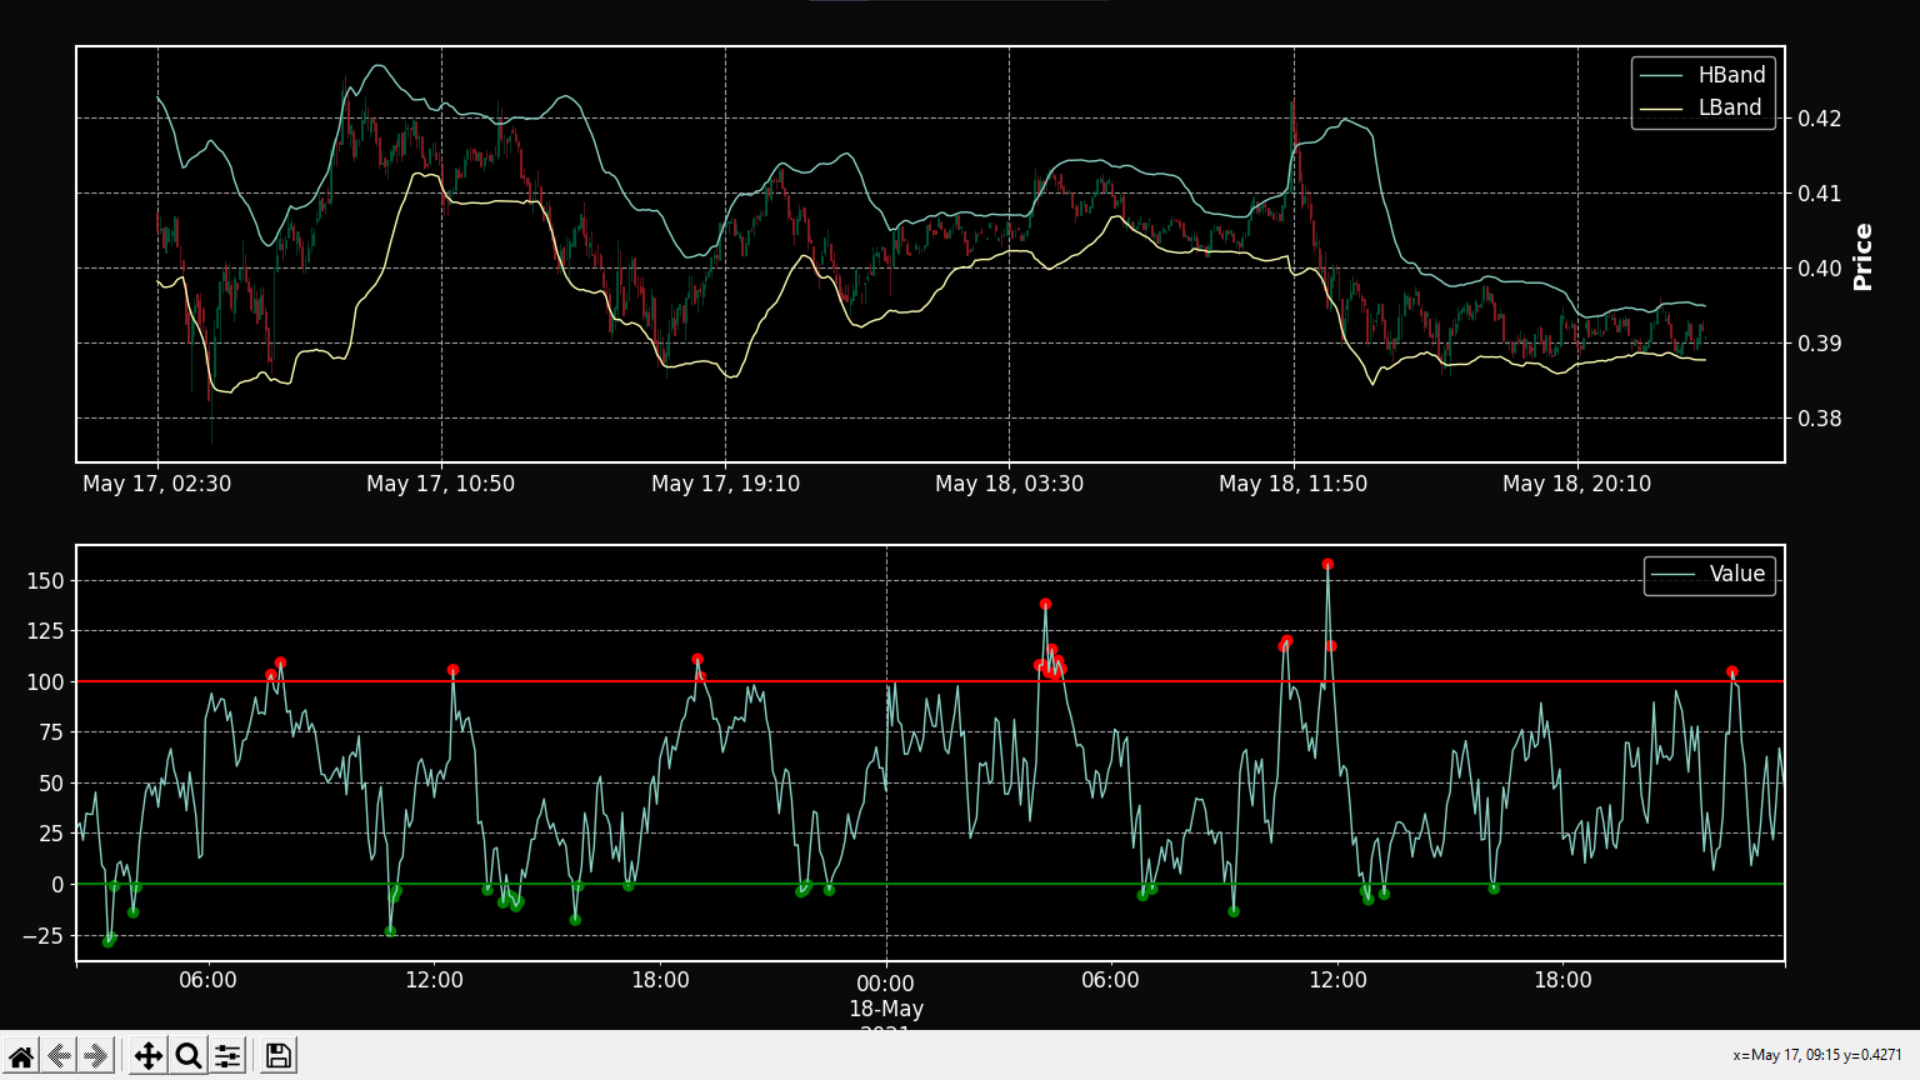
The GraphViewer is a GUI which has the ability to display in a simple way different data from GreedyBoy.
These informations will be displayed:
-
Plot 1
-
Price over time (candlesticks)
-
Bot’s actions (points)
-
Bollinger bands (lines)
-
-
Plot 2
-
Bollinger bands width (lines and points)
-
Volatility (lines)
-
Demonstration 
Code 
-
class
GraphViewer.GraphViewer( priceData : pandas.core.frame.DataFrame , bollingerData : pandas.core.frame.DataFrame , animateCallback = None , fullscreen : bool = True ) ¶ -
- Parameters
-
-
priceData ( DataFrame ) – Dataframe containing detailed informations about prices.
-
bollingerData ( DataFrame ) – Dataframe containing informations about bollinger gaps.
-
animateCallback ( Function ) – Callback called on the animation loop.
-
fullscreen ( bool ) – De/Activates fullscreen mode for Matplotlib.
-
Draws in 2 plots, the bollinger bands , the bollinger gaps and the price chart of a given cryptocurrency.
priceDataandbollingerDatamust be 2DataFrame(pandas) in these formats:Price Data
Date (as index)
Open
Close
High
Low
2021-04-24 05:00:00
1917.24
1920.21
1932.10
1899.24
1901.26
20.547
1860.124
1948.472
…
…
…
…
…
…
…
…
…
Bollinger Data
Date (as index)
Value
2021-04-24 05:00:00
67.00
…
…
-
ani= None ¶ -
Contains the animation callback.
-
setPricesData( priceData : pandas.core.frame.DataFrame , bollingerData : pandas.core.frame.DataFrame ) 
-
setReportData( reportData : pandas.core.frame.DataFrame ) 
-
start( ) ¶ -
Starts the graph.
Important
It is a blocking function (like an app.exec() in Qt).
-
GraphViewer.currencyInitial= 'XDG' ¶ -
Contains currency code of the cryptocurrency to get the prices from.
-
GraphViewer.main( ) 